Cambridge, Massachusetts
Cambridge Water Quality
Cambridge is not on the MWRA, and it does not look like Worcester either. It filters its own Fresh Pond supply through activated carbon, which is why the number that governs a treatment decision here is not a disinfection byproduct and not the service line.
One result on Cambridge's report exceeds the figure printed beside it, and it is not a contaminant anyone sells equipment for: sodium at 93.5 ppm against a state guideline of 20, from road salt.
The short answer
Cambridge is not an MWRA community. It supplies itself from the Hobbs Brook and Stony Brook reservoirs and Fresh Pond, and filters the water at its own plant through granular activated carbon — public water system 3049000. That carbon stage is why its disinfection byproducts are remarkably low: TTHM at 8.6 ppb against a limit of 80, roughly a seventh of Worcester's 63.
So the governing number here is neither the byproduct nor the service line. It is sodium at 93.5 ppm against a Massachusetts guideline of 20, from road salt — the only result on the report that exceeds the figure beside it. Carbon does not remove sodium and a softener would add more of it. If that figure matters at your address, reverse osmosis is the stage that addresses it.
Get a free test
Tell us your Cambridge-area address. We confirm coverage first, then schedule a licensed technician to test at your tap — no charge, no obligation.
What filtration does — and does not
Sediment, carbon, softening and reverse osmosis each address a different problem. In Cambridge the city already runs the carbon stage at the plant, which changes which of the four has anything left to do.
Which water system serves you?
Enter a ZIP code. We will name the utility that supplies it and its public water system identifier, so you can look up that system's own annual report. No contact details needed for this part.
Phoenix-metro ZIP codes are covered here. Five digits will do it.
A licensed technician tests at your own tap and tells you which findings actually apply to your house — including when the answer is none of them. Coverage is confirmed per service area rather than promised as blanket availability.
Where Cambridge water comes from
Its own reservoirs, its own plant at Fresh Pond, and a treatment train that differs from both of the Massachusetts systems it gets compared to — filtered where Boston is not, and carbon where Worcester uses anthracite.
Three reservoirs, and the watershed is in four towns
The Cambridge Water System extends across four towns and includes four bodies of water: the Hobbs Brook Upper and Lower reservoirs, Stony Brook Reservoir and Fresh Pond, storing up to 4.4 billion gallons between them, with 1,500 acres of surrounding watershed protection land. Water reaches Fresh Pond from Waltham through the Stony Brook Conduit, an 8-mile gravity-fed line. The city has run a publicly owned water supply since 1872.
Its own plant, at Fresh Pond
Everything is treated at the Walter J. Sullivan Water Purification Facility on Fresh Pond Reservation, in five stages: pretreatment combining preoxidation with ozone, coagulation and dissolved air flotation; a dedicated ozone stage; filtration; disinfection; and post-treatment. Payson Park holds finished water for distribution and fire protection, and more than 200 miles of pipeline carry it. This is what separates Cambridge from Boston — Boston's MWRA supply is not filtered at all.
Granular activated carbon is the filter medium
The filtration stage runs through granular activated carbon rather than the anthracite used in Worcester, and the report names it as the technology that removes organic compounds including PFAS. The department began replacing the GAC media more than three years ago and describes it as a best available technology for PFAS removal. This is the single most consequential fact on the page for anyone shopping for equipment, because GAC is the same medium a household carbon filter uses. The city is already running that stage at scale.
Monochloramine, like Boston — not free chlorine, like Worcester
Chlorine provides a second disinfection step for redundancy, and monochloramine is added to maintain a residual through the distribution system. Post-treatment adjusts pH for corrosion control and adds fluoride. Chloramine is less reactive with organic matter than free chlorine, which is half the explanation for why Cambridge's disinfection byproducts sit so far below Worcester's — the carbon filtration upstream is the other half.
An MWRA backup connection, actually used
Cambridge is not an MWRA community, but it is not unconnected to one either. The two have collaborated since 2013 on emergency and backup interconnections, and in December 2025 Cambridge used a small amount of MWRA supply to assist with purification facility maintenance. That makes Cambridge a third case rather than a variant of the other two: it runs its own water, and it has somewhere to fall back to. If you are reading a water report and cannot tell which supply was running, the date is what resolves it.
Lead service lines — 80 percent already gone
The department has built a comprehensive inventory of service line materials and states that since 1996 it has proactively removed 80 percent of the lead service lines in the city, with the remaining 20 percent scheduled to complete within five years of the report — which would meet MassDEP's goal eight years ahead of EPA's 2037 deadline. Cambridge also offers free tap water lead testing to any resident through a self-service kiosk at the purification facility. That is a materially different position from a city where the inventory is the open question.
What the report actually says
Federal and state limits are fixed regulatory values. The results next to them are from the City of Cambridge Annual Drinking Water Quality Report for PWS ID 3049000, whose masthead states it carries water quality information from 2025 — system-level and sampling-round figures, not a reading at your tap. The lead and copper figures carry the report's own footnote dating them to 2023 and are shown that way. A later report supersedes them.
Sodium — the number that governs here
Reported at 93.5 ppm against a Massachusetts Office of Research and Standards Guideline of 20 ppm, attributed by the report itself to road salt. That is 4.7 times the guidance value, and it is the only result on the report that exceeds the figure printed beside it. The ORSG is guidance rather than an enforceable limit, and it exists specifically for people on physician-directed sodium-restricted diets — MassDEP's salt complaint policy uses the same 20 mg/L figure as the trigger for investigating a supply where a resident is on a documented restriction below 1,000 mg a day. Nothing here is a violation. It is the one figure on the report worth taking to a doctor rather than to a contractor.
The same sodium, expressed the other way
The report's own footnote reads: an 8-ounce glass of Cambridge water contains approximately 22 milligrams of sodium, well within the FDA's very low sodium category. Both statements are accurate and they answer different questions. The FDA category is a food-labelling threshold applied per serving. The 20 ppm ORSG is a concentration guideline for a whole day's water, and MassDEP expresses it on the same 8-ounce basis — which works out near 4.7 mg per glass. Two litres a day of Cambridge water carries roughly 187 mg of sodium. Whether that matters is a medical question and not a plumbing one, which is exactly why it belongs on this page rather than in a sales conversation.
Chloride and total dissolved solids — the same story from the road
Chloride is reported at 167 ppm against a secondary standard of 250, and total dissolved solids at 323 ppm against 500. Both are inside their limits and both are elevated by the same cause the sodium row names. Secondary standards are aesthetic rather than health-based — taste, odour and staining — so these are not safety findings. They are corroboration: three results moving together in the direction road salt moves them.
Disinfection byproducts — and why they are so low
Total trihalomethanes at a highest running annual average of 8.6 ppb against a federal MCL of 80, with individual results ranging from 3.3 to 15.6. Haloacetic acids at 7.9 ppb against 60, ranging from 2.8 to 10.9. These are about 11 and 13 percent of their limits respectively. Forty miles west, Worcester reports 63 ppb of TTHM against the same 80 — roughly seven times Cambridge's figure. Two Massachusetts cities, both off the MWRA, both running their own filtration plants, and the difference is two treatment choices: carbon removes the organic precursors before disinfection, and monochloramine forms fewer trihalomethanes than free chlorine does.
PFAS
Massachusetts regulates a sum of six PFAS compounds with an MCL of 20 ppt. Cambridge reports PFAS6 at 6.4 ppt, with a range of non-detect to 6.4 — about a third of the limit. Two unregulated compounds are also reported: PFHxA at an average of 2.4 ppt ranging 0.8 to 3.2, and PFBS at 2.0 ppt ranging non-detect to 3.4, neither of which has a standard to compare against. Detected and comfortably inside the limit is the accurate description. Not present would not be.
Lead and copper — and the year on them
The report's lead and copper rows carry a footnote stating that the results are from the most recent sampling in 2023, because this monitoring runs on a multi-year cycle rather than annually. The 90th-percentile lead result was 8 ppb against an Action Level of 15, with individual samples ranging from non-detect to 14 ppb, and no home exceeded the Action Level. Copper's 90th percentile was 0.035 ppm against 1.3, ranging 0.003 to 0.042. Read those as a 2023 sampling round at other people's taps, not as a current measurement of your house.
Monochloramine residual and turbidity
Chlorine as monochloramine is reported at a highest running annual average of 2.42 ppm against an MRDL of 4, ranging 1.88 to 2.94 across the distribution system. Turbidity, which is the measure of how well the filters are working rather than a contaminant, ran to a highest reading of 0.192 NTU against a treatment technique requiring 95 percent of monthly readings below 0.3, with 100 percent of samples meeting it. Chloramine matters at the tap for one practical reason: it needs a longer contact time and a larger carbon bed to remove than free chlorine does.
Hardness — a derived figure, shown as one
Cambridge does not publish a hardness result, so there is no figure here to quote. It reports calcium at 18.2 ppm and magnesium at 3.9 ppm, and the standard conversion to hardness as calcium carbonate is 2.497 times the calcium plus 4.118 times the magnesium — which gives roughly 62 ppm, or about 3.6 grains per gallon. That sits on the boundary between soft and moderately hard, and it is meaningfully harder than Boston at about 1 grain or Worcester at about 1.7. It is still well below the level at which softening is normally considered, and in Cambridge there is a second reason to leave it alone, which is the sodium row above.
Three Massachusetts cities, three different answers
The reason this page exists separately from the other two is that the equipment conversation is genuinely different in each, and the difference comes from the treatment plant rather than from the marketing.
| Boston (MWRA) | Worcester | Cambridge | |
|---|---|---|---|
| Filtration | none — unfiltered supply | anthracite, direct filtration | granular activated carbon |
| Residual | monochloramine | free chlorine | monochloramine |
| TTHM against an 80 ppb MCL | — | 63 ppb | 8.6 ppb |
| Sodium against a 20 ppm ORSG | — | 18 ppm | 93.5 ppm |
| The governing question | the service line | disinfection byproducts | sodium from road salt |
Worcester's carbon purchase has a clear justification in Worcester's own numbers, and it is set out on the Worcester page. The same purchase in Cambridge is buying a second pass at a stage the city already runs — which is a perfectly reasonable thing to want for taste, and is not the same argument.
The figure that actually moves in Cambridge moves in the wrong direction for the most heavily marketed product in the category. Ion exchange softening trades hardness for sodium, and Cambridge is the one city of the three where the report already shows sodium above its guidance value. That is worth establishing before anyone measures a basement for a brine tank.
Where these figures come from
Everything on this page traces to primary sources. Independent compilations of water quality data exist and are not used here.
- City of Cambridge Annual Drinking Water Quality Report — public water system 3049000. The masthead states that it carries water quality information from 2025 and was distributed June 2026; the lead and copper rows carry a footnote dating those results to 2023.
- Cambridge Water Department — the utility itself, including free lead test kits for residents and the cross connection control program.
- MassDEP Drinking Water Standards and Guidelines — the Office of Research and Standards Guideline of 20 mg/L for sodium, and the Massachusetts PFAS6 limit of 20 ppt.
- EPA National Primary Drinking Water Regulations — federal limits, including TTHM 80 ppb, HAA5 60 ppb, the lead Action Level of 15 ppb and copper 1.3 ppm.
- EPA SDWIS Federal Reports — search public water system identifier MA3049000.
Matching treatment to the finding
Filtration is not one product. In a city that already filters through carbon and reports its one out-of-guidance number as sodium, the usual recommendation order is close to reversed.
A carbon filter — worth knowing the city already runs one
Carbon is the right medium for chlorine taste and for disinfection byproducts, and in most cities it is the obvious first purchase. Cambridge is the unusual case where the municipal plant already filters through granular activated carbon, and the resulting byproduct numbers are about 11 and 13 percent of their limits. A household carbon filter here is a taste and polish decision rather than a remedy for a finding. It is a legitimate thing to want. It is not a thing the report argues you need.
A softener — no, and for a stronger reason than usual
In Boston and Worcester the case against a softener is that the water is already soft. In Cambridge the derived hardness of roughly 3.6 grains per gallon is higher, so that argument is weaker — and a better one replaces it. Ion exchange softening works by trading hardness minerals for sodium, so it adds sodium to water already reporting 93.5 ppm against a 20 ppm guideline. Of the three Massachusetts cities on this site, Cambridge is the one where a softener would make the report's one out-of-guidance number worse.
Reverse osmosis — the stage that actually matches the finding
Sodium is a dissolved ion. Carbon does not remove it and a softener adds it, so if the sodium figure is the one that matters at your address, reverse osmosis at the kitchen tap is the stage that addresses it. It treats one tap rather than the house, sends water to drain, and costs more to maintain than a carbon cartridge. Whether that trade is worth making is a question for whoever is on the sodium-restricted diet, and it is worth asking before, not after, somebody proposes whole-house equipment.
A lead-reduction filter — only if your own line says so
The 2023 sampling round put the 90th percentile at 8 ppb against an Action Level of 15, with no home exceeding it, and 80 percent of the city's lead service lines are already gone. Both of those are citywide facts and neither describes your building. Cambridge gives away lead test kits for exactly this reason. A certified lead-reduction filter is a sound answer to a result at your tap and a poor answer to a number in a report, and the test costs nothing.
How the free test works
A licensed technician tests at your kitchen tap, walks the plumbing, and tells you which of the findings above applies to your house and which does not. There is no charge and no obligation, and nothing has to be decided while someone is standing in your kitchen.
In Cambridge the address matters for a specific reason, and it is not the one that applies in Worcester. Sodium is a system-wide figure and will not vary much between two Cambridge kitchens. Lead will, because 20 percent of the city's lead service lines are still in the ground and they belong to particular buildings. The city gives away test kits for that question, and an honest assessment says so rather than routing every enquiry toward equipment.
If the honest finding is that your address does not need equipment, that is the finding. A free test that always ends in a recommendation is not a test.
Seamless Home is the licensed contractor of record on the work that follows. Installation is performed by vetted installing partners engaged as our subcontractors, and the workmanship obligation stays with us. Coverage is confirmed per service area rather than promised as blanket availability.
Two installation details outlive the equipment choice. Any under-sink reverse osmosis unit discharges to the drain, and the plumbing code will not let that line connect directly — where a water softener is allowed to discharge sets out the indirect-waste rule that governs it. And Cambridge's own report devotes a section to cross connections, using the garden hose and fertiliser sprayer as its worked example and recommending a hose bib vacuum breaker as the fix — does an outdoor faucet need a vacuum breaker covers which of those devices the code actually accepts, and why the wrong one damages a frost-proof tap.
What a water treatment job with us covers
Installation and replacement of whole-home and point-of-use treatment, specified against what your water actually contains.
Sediment filtration
Installation of the first stage that protects everything downstream of it, sized to the service line and the household draw.
Softening
Installation of ion-exchange softening where hardness is the problem, including the drain connection the plumbing code treats as indirect waste.
Carbon filtration
Installation of carbon stages for taste, odour and disinfection by-products, specified from your utility's own water quality report.
Reverse osmosis
Point-of-use installation at the kitchen sink where the target is dissolved solids rather than whole-home flow.
Disinfection
Installation of UV or equivalent treatment where the supply is a private well or is otherwise not continuously disinfected.
System replacement
Replacing equipment that has reached the end of its service life, including the discharge and air gap details an inspector looks at.
This is installation and replacement work, specified from a published water quality report or a test of your supply — not from a sales chart. Coverage is confirmed per service area rather than promised as blanket availability.
What the work actually looks like
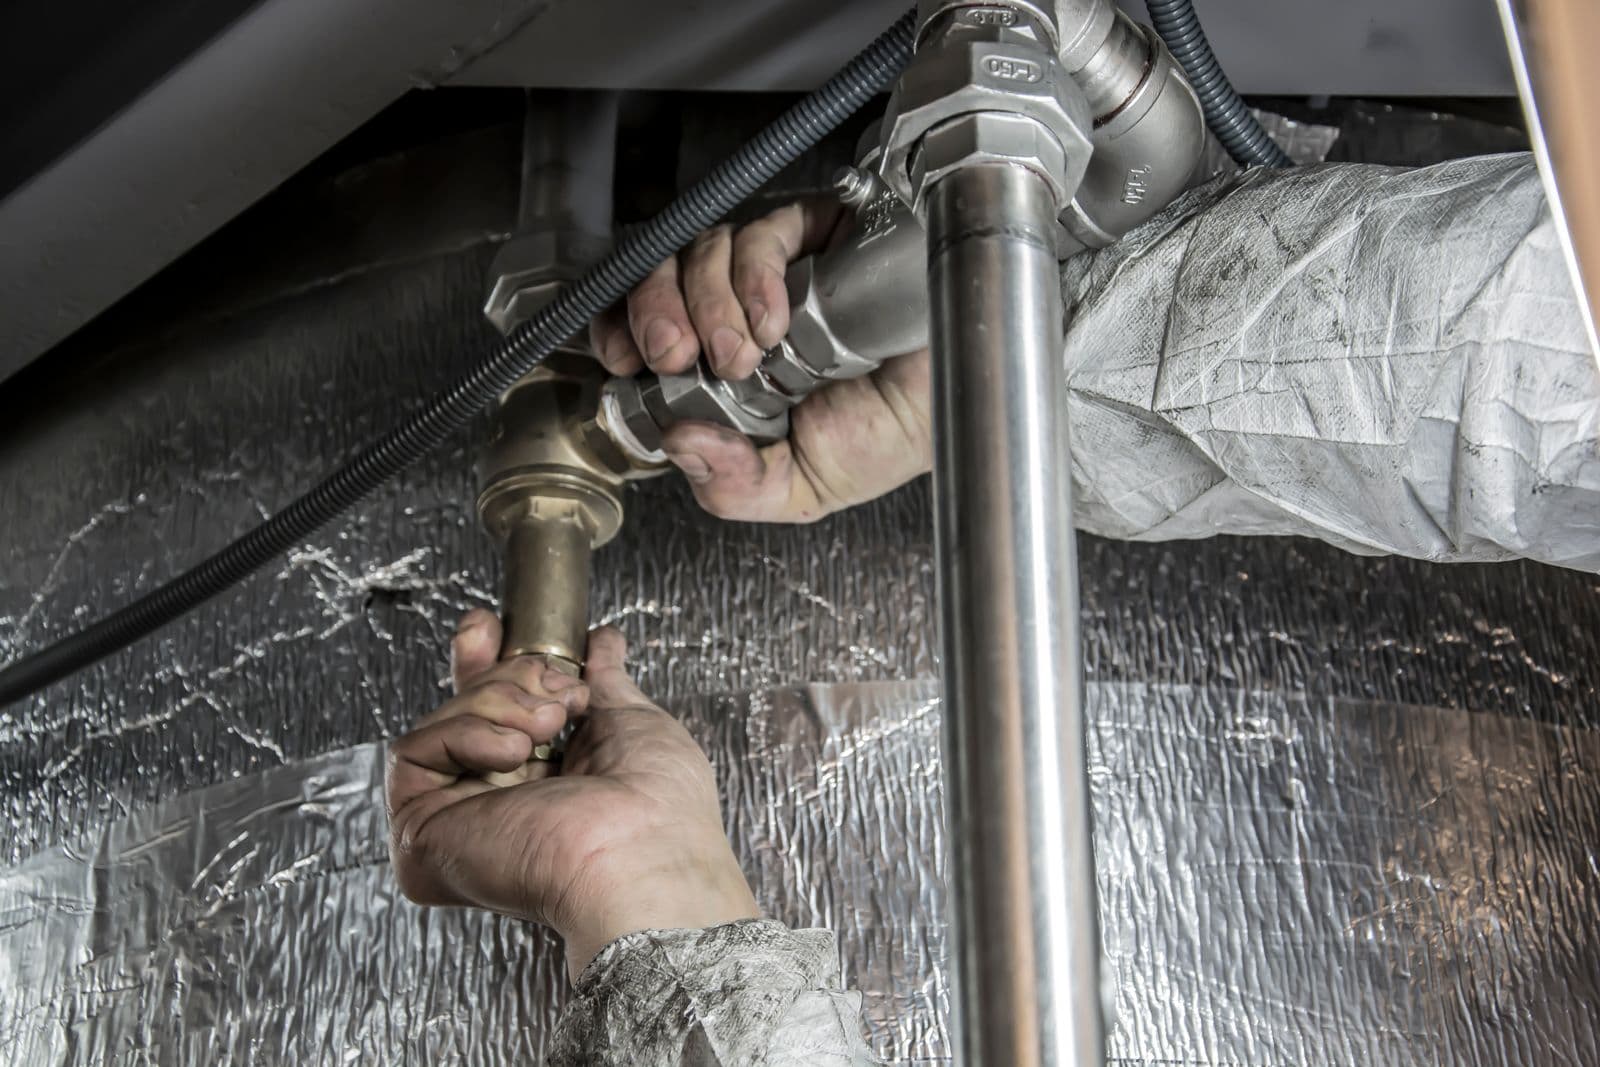
Treatment equipment is plumbing. Most of the job is the connection, the drain and the code detail behind it.


Cambridge water, answered plainly
Is Cambridge on the MWRA?+
No. Cambridge runs its own supply and its own treatment plant, under public water system identifier 3049000. This is the single most useful thing to know before reading anything about Massachusetts water, because MWRA's figures are the ones that circulate for the whole state and they describe a different system. Cambridge draws from the Hobbs Brook Upper and Lower reservoirs, Stony Brook Reservoir and Fresh Pond — four bodies of water across four towns, storing up to 4.4 billion gallons — and treats all of it at the Walter J. Sullivan Water Purification Facility at Fresh Pond. There is a qualification worth knowing: Cambridge and the MWRA have maintained emergency and backup interconnections since 2013, and in December 2025 Cambridge used a small amount of MWRA water during purification facility maintenance. It is not an MWRA community; it has an MWRA fallback.
What is the one number on Cambridge's report worth paying attention to?+
Sodium, at 93.5 ppm against a Massachusetts Office of Research and Standards Guideline of 20 ppm, attributed by the report to road salt. It is the only result that exceeds the figure printed beside it. The ORSG is guidance rather than an enforceable limit and there is no violation here, but the guideline exists for a specific group of people — those on physician-directed sodium-restricted diets — and MassDEP uses the same 20 mg/L figure as the trigger for investigating a supply where a resident is on a documented restriction below 1,000 mg a day. Chloride at 167 ppm and total dissolved solids at 323 ppm corroborate the cause. If a household has someone managing sodium intake, this is a conversation for a doctor, and reverse osmosis is the treatment stage that addresses it.
The report says a glass of Cambridge water is very low sodium. Which is right?+
Both, and they answer different questions. The footnote states that an 8-ounce glass contains approximately 22 milligrams of sodium, well within the FDA's very low sodium category — that is a food-labelling threshold applied per serving, and 22 mg per glass does sit inside it. The 20 ppm ORSG in the guidance column of the same table is a concentration for a whole day's water, and MassDEP expresses it on the same 8-ounce basis, which works out near 4.7 mg per glass. So one glass is very low sodium by FDA labelling and 4.7 times the state guidance concentration at the same time, because the two benchmarks were written for different purposes. Two litres a day of Cambridge water carries roughly 187 mg. Neither figure is wrong; only one of them is about sodium-restricted diets.
Why are Cambridge's disinfection byproducts so much lower than Worcester's?+
Because of two treatment choices, and the gap is large: total trihalomethanes at 8.6 ppb in Cambridge against 63 ppb in Worcester, both measured against the same federal MCL of 80. Disinfection byproducts form when a chlorine-based disinfectant reacts with naturally occurring organic matter, so the amount depends on how much organic carbon reaches the disinfection stage and which disinfectant meets it. Cambridge filters through granular activated carbon, which removes organic compounds before disinfection, and maintains its residual with monochloramine, which is less reactive for this purpose. Worcester filters through anthracite and disinfects with free chlorine. Both cities are fully compliant. The difference is chemistry, and it is the reason the right equipment is not the same in two Massachusetts cities forty miles apart.
Do I need a water softener in Cambridge?+
Almost certainly not, and here the reason is different from the one that applies in Boston or Worcester. Cambridge does not publish a hardness figure; it reports calcium at 18.2 ppm and magnesium at 3.9 ppm, which converts to roughly 62 ppm or about 3.6 grains per gallon — on the boundary between soft and moderately hard, and genuinely harder than Boston or Worcester. So the usual New England argument, that there is nothing to remove, is weaker here. The stronger argument is what softening does: ion exchange trades hardness minerals for sodium, and Cambridge water already reports 93.5 ppm of sodium against a 20 ppm guideline. A softener would push the one out-of-guidance number on the report further out.
Is the water safe to drink?+
Every regulated contaminant in the report is inside its federal or state limit, with no violations recorded. Turbidity, which measures how well the filtration is working, met its treatment technique on 100 percent of samples. What a compliance statement cannot describe is the water at your own tap, and in Cambridge there is one specific reason for that: lead comes from service lines and household plumbing rather than from the source, and although the city has removed 80 percent of its lead service lines since 1996, the remaining 20 percent belong to particular addresses. The 2023 sampling round gave a 90th-percentile lead result of 8 ppb against an Action Level of 15 with no exceedance. That is a good citywide result and it is not a measurement of your building, which is why the city gives away test kits.
Why are the lead results in the report dated 2023?+
Because lead and copper monitoring runs on a multi-year cycle rather than annually, and the report says so in a footnote: results are from the most recent sampling in 2023. A system demonstrating low results is permitted to sample less often. The figures are a 90th-percentile lead result of 8 ppb against a 15 ppb Action Level, individual samples ranging from non-detect to 14 ppb, and no home exceeding the Action Level. Copper's 90th percentile was 0.035 ppm against 1.3. Read them as evidence that the water leaving the plant is not aggressively corrosive, rather than as a current reading at any particular address — and note that Cambridge offers free lead testing to any resident through a kiosk at the purification facility, which answers the address-specific question directly.
What about the drought restrictions?+
The report states that Cambridge and the Northeast region are in a Level 3 Critical Drought, with all non-essential outdoor watering banned under City Ordinance, and that persistent conditions have kept reservoir levels significantly below the fifteen-year average. A Water Ordinance Drought Amendment took effect in April 2025 to comply with new MassDEP regulations, setting graduated restrictions by drought level. This is a supply question rather than a quality one and it does not change what is in the water, but it is worth knowing before planning anything that uses water outdoors — and reverse osmosis systems send water to drain, which is a fair thing to raise in a drought year.
Where do these figures come from?+
The City of Cambridge Annual Drinking Water Quality Report for public water system 3049000, whose masthead states Water Quality Information From 2025 and Distributed June 2026, plus the federal and Massachusetts drinking water standards the report compares against. The lead and copper figures within it carry the report's own footnote dating them to 2023 and are presented that way here. The hardness figure is not in the report at all; it is derived from the reported calcium and magnesium using the standard conversion, and is shown as a derivation rather than quoted as a result. Independent compilations of water quality data exist and are not the source used on this page. Every figure is a system-level or sampling-round result, and none of it is a reading at your address.
Related resources
Home water purification and treatment
The national service page behind this one: what each treatment stage removes, and why a test comes first.
Learn more →Worcester water quality
The other off-MWRA city in the state — anthracite, free chlorine, and disinfection byproducts seven times higher.
Learn more →Boston water quality
The MWRA system next door — unfiltered, and with the service line as the governing question.
Learn more →Battery backup in Cambridge, MA
Storm outages, and what a battery does and does not cover.
Learn more →Does an outdoor faucet need a vacuum breaker?
The cross connection Cambridge's own report singles out, and the device class the code accepts.
Learn more →All home services
Water treatment, battery backup, HVAC and solar under one licensed contractor of record.
Learn more →Get a free test at your tap
A licensed technician tests at your kitchen tap and tells you which of the findings above applies to your house — and which does not. No charge, no obligation, and coverage confirmed at your address first.
Get a free test