Woburn, Massachusetts
Woburn, MA Water Quality
Woburn blends MWRA water with its own Horn Pond wells. The local wells' PFAS6 averaged 19.15 ppt in 2025, just under the 20 ppt state standard.

Horn Pond PFAS6 avg 19.15 ppt (MA limit 20), samples to 22.9 · Sodium 98 ppm · Hardness 80 ppm.
The short answer
Woburn is only partly on MWRA. In 2025, 47.5% of its water came from the City's own Horn Pond well field and 52.5% from MWRA's Quabbin and Wachusett reservoirs.
The number to know is PFAS6: the Horn Pond water averaged 19.15 ppt against Massachusetts' 20 ppt standard, with samples up to 22.9. One October 2025 sample was over, but the quarter met the standard. The City says a PFAS removal facility is under construction. Sodium in the local water was 98 ppm. Reverse osmosis at the kitchen tap reduces both.
Get a free test
Tell us your Woburn address. We confirm coverage first, then schedule a licensed technician to test at your tap — no charge, no obligation.
What filtration does — and does not
Carbon, catalytic carbon and reverse osmosis solve different problems. Woburn's local results point at PFAS and sodium.
Where Woburn water comes from
Two supplies, one City system.
Horn Pond well field
Woburn's municipal wells supplied 47.5% of its water in 2025 through the Horn Pond treatment plant, rated at 4.07 million gallons a day. MassDEP's 2003 source water assessment rated its susceptibility high.
MWRA reservoirs
The other 52.5% is MWRA water from the Quabbin and Wachusett reservoirs, treated at the John J. Carroll plant in Marlborough. MWRA reports meeting every standard in 2025.
City distribution
Woburn DPW serves about 12,000 residential and commercial customers and tests 21 distribution locations weekly or quarterly.
What the 2025 Woburn report actually says
Limits are fixed. Results are from the City of Woburn's letter in MWRA's 2025 Drinking Water Test Results and describe the local Horn Pond supply. They are not a reading at your tap.
PFAS6 averaged 19.15 ppt (limit 20)
The local supply ranged from 12.0 to 22.9 ppt. One October 2025 sample was over the standard, but the quarter met it. Woburn received a Notice of Non-compliance for PFAS6 in 2023.
Sodium 98 ppm
The local supply ranged from 96 to 100 ppm, attributed to road salt. There is no MCL for sodium; the report lists 20 ppm as its goal.
TTHM averaged 55.5 ppb (limit 80)
Samples ranged from 6.1 to 64.4 ppb. Haloacetic acids averaged 13.51 ppb (limit 60).
Hardness 80 ppm
The Horn Pond treated water measured 80 ppm hardness, pH 8.3 and manganese 14 to 19 ppb, with iron not detected.
Lead: 0 of 32 over
Lead was 1.28 ppb at the 90th percentile and copper 128 ppb, with none of 32 samples over either action level. The 2024 inventory found no lead service lines, but a few galvanized lines that could contribute lead.
Arsenic 0.70 ppb
Well under the 10 ppb limit. Nitrate was 0.391 ppm, fluoride 0.62 ppm and chlorine 1.16 ppm.
Woburn next to Medford and Lexington
Medford and Lexington are fully supplied by MWRA, so their reports are mostly about reservoir water and local pipes. Woburn's own wells add a second set of results, and those are where PFAS and sodium show up.
The City says its PFAS removal facility was expected online in late summer 2026. Until results after that change are published, this page reports the 2025 figures only.
Where these figures come from
Everything on this page traces to the City of Woburn and MWRA.
- MWRA and City of Woburn — 2025 Drinking Water Test Results (PDF) — supply split, Horn Pond results, PFAS6, sodium, byproducts, lead and copper, and the service line inventory.
- City of Woburn — PFAS — the City's PFAS updates and historical test results.
Matching treatment to the finding
Woburn's local results support PFAS and sodium reduction at the tap. Hardness at 80 ppm does not call for a softener.
Reverse osmosis for PFAS and sodium
An under-sink RO system certified for PFAS reduction lowers PFAS6 and sodium in drinking and cooking water. It is the most direct answer to this report.
Carbon as a whole-house stage
Activated carbon reduces chlorine taste and trihalomethanes, and certified carbon systems also reduce some PFAS.
Check galvanized service lines
The City notified owners of galvanized lines that could contribute lead. If you received a letter, a tap test for lead is worth doing.
Test at the tap first
Your share of Horn Pond versus MWRA water depends on where you live in the system. A test at your kitchen tap shows what reaches your house.
How the free test works
A licensed technician tests at your kitchen tap, walks the plumbing, and tells you which of the findings above applies to your house and which does not. There is no charge and no obligation.
Seamless Home is the licensed contractor of record on the work that follows. Installation is performed by vetted installing partners engaged as our subcontractors, and the workmanship obligation stays with us. Coverage is confirmed per service area rather than promised as blanket availability.
What a water treatment job with us covers
Installation and replacement of whole-home and point-of-use treatment, specified against what your water actually contains.
Sediment filtration
Installation of the first stage that protects everything downstream of it, sized to the service line and the household draw.
Softening
Installation of ion-exchange softening where hardness is the problem, including the drain connection the plumbing code treats as indirect waste.
Carbon filtration
Installation of carbon stages for taste, odour and disinfection by-products, specified from your utility's own water quality report.
Reverse osmosis
Point-of-use installation at the kitchen sink where the target is dissolved solids rather than whole-home flow.
Disinfection
Installation of UV or equivalent treatment where the supply is a private well or is otherwise not continuously disinfected.
System replacement
Replacing equipment that has reached the end of its service life, including the discharge and air gap details an inspector looks at.
This is installation and replacement work, specified from a published water quality report or a test of your supply — not from a sales chart. Coverage is confirmed per service area rather than promised as blanket availability.
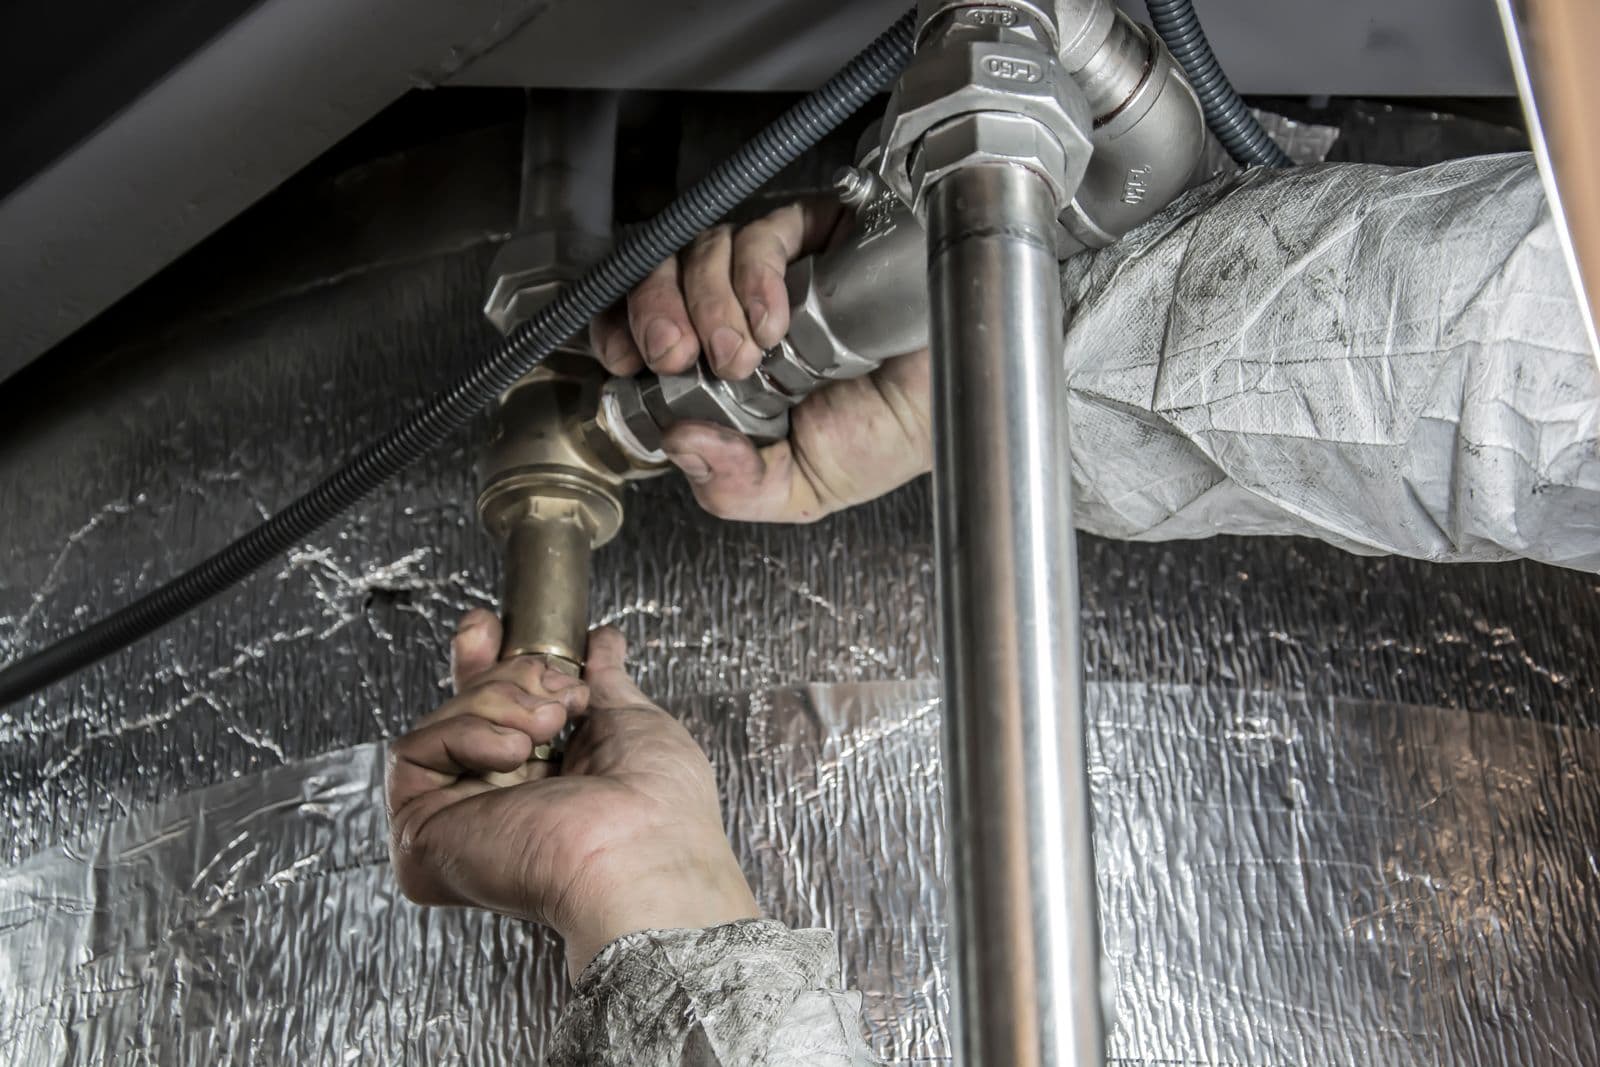
What the work actually looks like
Treatment equipment is plumbing. Most of the job is the connection, the drain and the code detail behind it.


Woburn water, answered plainly
Where does Woburn's water come from?+
Two sources. In 2025, 47.5% came from the City's Horn Pond well field and 52.5% from MWRA's Quabbin and Wachusett reservoirs.
Is there PFAS in Woburn's water?+
Yes, in the local supply. PFAS6 from the Horn Pond wells averaged 19.15 ppt in 2025 against the 20 ppt Massachusetts standard, with samples from 12.0 to 22.9 ppt. One October 2025 sample was over, but the quarter met the standard. MWRA reports its own water is well below the standard.
Is Woburn building PFAS treatment?+
The City's 2025 report says construction of a PFAS removal facility has begun, with the facility expected online in late summer 2026.
Why is there sodium in Woburn's water?+
The City attributes it to road salt. The local supply measured 96 to 100 ppm in 2025. People on sodium-restricted diets may want to ask their doctor.
Is Woburn's water hard?+
The Horn Pond treated water measured 80 ppm hardness in 2025, which is moderate.
Where do these figures come from?+
From MWRA's 2025 Drinking Water Test Results with the City of Woburn DPW letter, published June 2026. Third-party aggregators are not used.
Related resources
Home water purification and treatment
The national service page behind this one.
Learn more →Medford water quality
A fully MWRA-supplied neighbor.
Learn more →Lexington water quality
Another MWRA community next door.
Learn more →Melrose water quality
MWRA water and Melrose's local results.
Learn more →Philadelphia water quality
PFAS that meets Pennsylvania's limits but not EPA's 2029 limits.
Learn more →All home services
Water, battery, HVAC and solar under one licensed contractor of record.
Learn more →Get a free test at your tap
A licensed technician tests at your kitchen tap and tells you which findings apply to your house — PFAS, sodium or your own plumbing. No charge, no obligation, and coverage confirmed at your address first.
Get a free test